

Picture opening your case list on the first of the month and knowing, for every open file, what stage it sits in, which month it is likely to resolve, and whether the delay holding it up is one your firm can fix. The personal injury case management KPIs in this article give you exactly that view: a way to see your open caseload as a pipeline you manage rather than a stack of files you wait on.
This is Part 2 of a four-part series on the personal injury law firm KPIs that drive financial performance. Part 1 covered the marketing and intake numbers that tell you what a signed case actually costs. Part 2 picks up the moment the retainer is signed and follows the case through to a disbursed settlement. Parts 3 and 4 will cover cash flow and profitability.
Total case duration is the wrong number to chase
Most firms that track case timing track one number: how long the average case takes. That number is interesting, but it is the wrong thing to manage, because it blends two clocks that behave nothing alike.
The first clock is the time you do not control. Medical treatment runs as long as the injury requires. Adjusters respond on their own schedule. Once a suit is filed, the court calendar takes over. None of that moves faster because you want it to.
The second clock is the time you do control. It is the days a file sits between stages, the lag between records arriving and a demand going out, and the handoff time when a case moves from one person on your team to the next. This second clock is invisible on a single duration figure, yet it is the only part of the timeline you can actually shorten. Separate the two, and case timing turns from a complaint into a set of decisions.
What is case cycle time?
Case cycle time is the average number of months it takes to move a case from a signed retainer to a disbursed settlement. It is the operational cousin of the financial questions you care about most, because in a contingency model your fee arrives only at the end of that cycle. Every month a case stays open is a month your capital stays committed to it. A related measure, settlement cycle time, isolates the back end of that clock: the weeks between an agreed settlement and the disbursed check, where lien resolution and check processing quietly add time you can manage.
For context, not as a target: the National Center for State Courts found that personal injury and tort matters take roughly 16 months on average to reach disposition once filed, with about 69% resolved within a year and a half. Federal court data through September 2024 puts the median civil case at 15.6 months from filing to disposition, rising to about 30.7 months for the small share that resolve during or after trial. The lesson in those numbers is not “go faster.” It is that litigation roughly doubles the clock, so the decision of whether and when to file is one of the largest timing levers you hold.
The clock you control
Here is where the personal injury case management KPIs earn their place. Each of the metrics below isolates time your firm owns, which means each one points to a fix.
Time in stage. Tag every open case by stage: treatment, records collection, demand, negotiation, litigation. Then measure the average days a case spends in each. A backlog in one stage is a process problem with an address, not a vague sense that things are slow.
Stalled cases. Count files with no meaningful activity in 90 days or more. A common benchmark keeps this under 10% of the open caseload. A rising stalled count is the earliest warning that your team is past capacity, well before it shows up in revenue.
Medical records turnaround. You cannot control how fast a provider produces records, but you control everything around the request. In Texas the law works in your favor here. Hospitals must release records no later than the 15th day after a complete request under Texas Health and Safety Code §241.154, and physicians face the same 15-day clock under Texas Medical Board rule §163.3, both tighter than the federal HIPAA standard of 30 days. With a clean authorization sent to the right custodian and a follow-up schedule, requests land in roughly two weeks. Without that discipline, the same records can drift for two months or more while the file sits idle.
Demand turnaround. Measure the days between a complete file and a demand sent. This is one of the purest tests of internal efficiency, because nothing outside your office controls it. A demand that sits for three weeks on a desk is three weeks of cycle time you gave away for free.
Insurer response time. This one is shared. You send the demand; the insurer answers on its own clock, commonly within 30 to 60 days, with silence past 90 days often signaling strategy rather than confusion. You cannot force a faster reply, but tracking it tells you when polite pressure or a filing deadline is the right next move.
The clock you do not control, and the line you do not cross
The uncontrollable clock deserves respect, not a stopwatch. A client reaches maximum medical improvement when their body decides, not when your pipeline would prefer. Adjusters, liens, and courts run on timelines you can influence at the margins and never command.
This leads to the one rule that governs every metric on this page: speed is never the goal, and you never trade a stronger result for a faster one. The only duration worth cutting is the duration that serves no one, the file sitting idle between stages while everyone waits on everyone else. Letting a client finish treating, building the full medical record, and holding out for the right number are not delays to optimize away; they are the work. A case that resolves quickly but light is a worse outcome, not a better KPI. The client’s interests and the client’s wishes come first, and a good case management system protects that priority rather than competing with it.
Stage clarity is what makes your cash flow predictable
Here is the part most firms miss. The same stage data that helps you spot bottlenecks is also the single best input to a real cash flow forecast.
When every open case carries a stage and each stage carries a typical time to resolution, you can estimate which months your settlements are likely to land. That turns “we will probably close some cases this quarter” into a month-by-month projection you can staff, spend, and borrow against. Without it, you are guessing, and the guess is expensive: personal injury firms take 184 days on average to get paid once work is underway, so the gap between effort and cash is wide enough that planning across it is not optional.
A stage-tagged case list is the bridge between how your cases run and how your firm plans. It is the difference between watching your bank balance and forecasting it.
Read case duration against case value
A long case is not automatically a problem, and a short one is not automatically a win. The right way to read duration is alongside the fee the case is expected to produce.
Consider two files. A litigated case generates $32,000 in fees but ties up an attorney for 22 months. A pre-litigation case generates $10,000 in 10 months. Measured by revenue per attorney-month, the litigated case earns about $1,450 a month and the pre-litigation case about $1,000. Now the comparison is honest: the long case is not a drag, it is the better use of capacity, and a docket full of small files that each take most of a year is the quiet problem. Pair this with a simple capacity read, since most personal injury attorneys carry somewhere between 40 and 50 active cases effectively, and you can see when your caseload per attorney is crowding out the high-value work rather than supporting it.
This is why case duration and case value belong on the same line. One without the other sends you chasing the wrong cases off the docket.
The personal injury case management KPIs on one scorecard
Tracked together, these metrics form a monthly case operations scorecard. The figures below are illustrative, showing the shape of a healthy month for a three-attorney firm, not benchmarks to match.
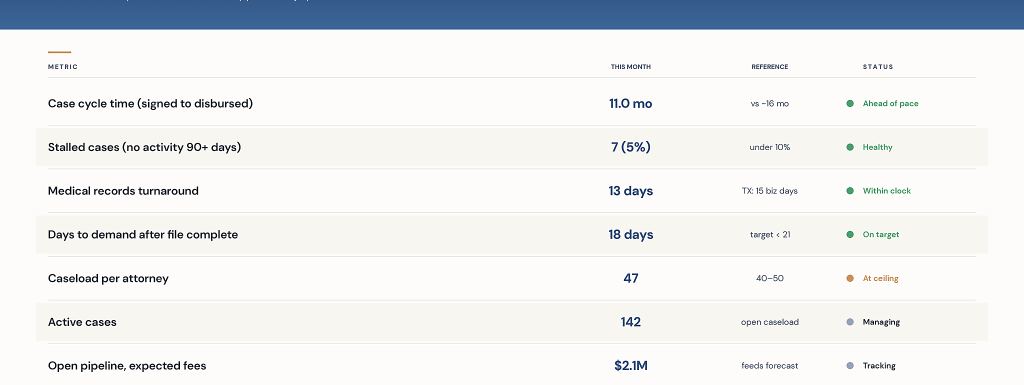
Save a version of this scorecard each month and the trend tells you more than any single figure. A creeping stalled count, a demand-turnaround number that drifts from 18 days to 30, a caseload per attorney climbing past 50: each one is an early signal you can act on while it is still cheap to fix.
Where to start
You do not need all of this at once. Start by tagging your open cases by stage and counting how many have not moved in 90 days. That one exercise usually surfaces the bottleneck within an afternoon, and it gives you the foundation for everything else, including the cash flow forecast that stage data makes possible. These case operations metrics are one slice of the personal injury law firm KPIs this series maps end to end.
If you would like a second set of eyes on which personal injury case management KPIs to track first and how to wire them to your cash flow planning, we will figure it out together. A 30-minute discovery call will help us find where your cases are quietly stalling and what to measure to fix it.
In Part 3, we will turn to cash flow and liquidity: how to read your settlement pipeline, size your reserves, and stop letting case timing dictate your firm’s stress level. The foundation for that conversation starts with budgeting that fits how a contingency firm actually earns.